A Beginner’s Guide to Observability: Understanding the Basics
What is Observability ?
Observability is like having superpowers for your applications systems. It’s all about how well we can see and understand what’s going on inside those systems. To do this, we use special tools that help us collect important information about the system’s health.
Why Is Observability Important ?
Observability is crucial for several reasons:
Visibility: It helps us see what’s happening in our systems, like a window into a room. This helps us spot issues and understand how things work.
Real-time Troubleshooting: It allows us to fix problems as they happen, like solving a puzzle in real-time, ensuring our systems run smoothly.
Customer Experience: Observability ensures a better experience for users by keeping applications reliable and fast.
Application Cost Savings: By catching and fixing issues early, it can save money and resources in the long run, like preventing a small leak from becoming a big flood.
Components of Observability:
Observability consists of three main components:
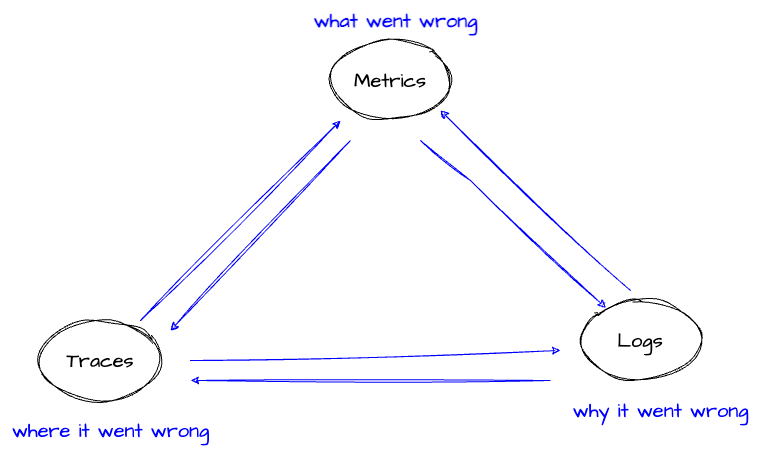
Metrics: These are like numbers that tell us how the system is doing. For example, it can tell you if the application is running fast or slow.
Logs: Logs are like detailed diaries of what the application is doing. They record every action, like a diary keeps track of your day.
Traces: Traces are like maps that show how a request or action moves through the system. They help us find out what’s happening step by step.
In simpler terms, observability helps us understand:
What our system is doing: It’s like looking at the activities of your computer or software, similar to checking what someone is doing in a game.
How they are doing it: It tells us the way things are happening, like whether the computer is running smoothly or having trouble, just like watching a car to see if it’s driving smoothly or making strange noises.
How long and how well: This part is about how fast or slow things are happening and how good or bad the system is performing, just like timing how fast a runner is or how well they’re doing in a race.
Here are some beginner-friendly steps to start with observability:
Select Tools: Choose observability tools that match your system and application. Common tools include Prometheus, Grafana, Elasticsearch, and AWS CloudWatch. There are user-friendly options for beginners.
Set Up Monitoring: Begin by monitoring critical metrics, such as CPU usage, memory, and response times. This helps you understand your system’s baseline performance.
Implement Logging: Configure your system to generate logs. Start with basic log events and gradually add more details as needed. Tool like Fluent bit can help with logging.
Explore Tracing: While tracing can be more complex, consider adding it once you’re comfortable monitoring and logging. Tools like AWS X-Ray can assist in tracing requests.
Learn and Iterate: Observability is an ongoing learning process. Familiarize yourself with the tools, analyze data, and make improvements as you gain experience.
Conclusion:
Observability is a valuable concept for anyone dealing with technology. It’s not just for experts but can be understood and applied by beginners. By monitoring, logging, and tracing your systems, you’ll be better equipped to maintain, troubleshoot, and optimize your applications and provide a smoother experience for users. As you dive deeper into observability, you’ll discover the immense power it holds in the world of technology.
In the upcoming blog, we will guide you through the process of implementing observability for applications running on Amazon EKS.