n the world of modern software development, understanding how your applications perform in real-time is crucial. Without proper observability, debugging issues, optimizing performance, and ensuring reliability can be like navigating in the dark. This is where OpenTelemetry comes to the rescue. In this guide, we’ll explore what OpenTelemetry and ADOT is and how to get started with it to gain valuable insights into your applications.
What is OpenTelemetry ?
OpenTelemetry is a standardized framework that offers a comprehensive set of tools, APIs, and software development kits (SDKs) tailored for cloud-native applications. Its primary purpose is to facilitate the instrumentation, generation, collection, and export of vital telemetry data, including metrics, logs, and traces. This telemetry data is instrumental for analyzing and understanding the performance and behavior of your applications.
OpenTelemetry does not function as an analysis platform itself. Instead, it empowers you with the flexibility to select your preferred back-end systems for telemetry data storage and analysis, as long as these back-ends are compatible with OpenTelemetry standards.
what is telemetry signal ?
A telemetry signal refers to any data received in the form of metrics, logs, or traces.
What is otel collector ?
 The “Otel Collector” acts as a middleman between your application and the system that analyzes the data. It’s like a translator that takes information from your application and makes sure it’s in a format that can be easily understood by different analysis tools. This way, you can use various tools to study the data without worrying about compatibility issues.
It’s all about making the information flow smoothly and work with different systems.
The “Otel Collector” acts as a middleman between your application and the system that analyzes the data. It’s like a translator that takes information from your application and makes sure it’s in a format that can be easily understood by different analysis tools. This way, you can use various tools to study the data without worrying about compatibility issues.
It’s all about making the information flow smoothly and work with different systems.
Otel collector Components
Receivers- Gathers signals from source in the specified format
- Example : Prometheus, x-ray, statsD, jaeger, opentelemetry
Processors- Enrich signals, allocated memory and process data
- Example : batch or filter processor
Exporters:- send signals to a specified destination
- Example : prometheusremotewrite, x-ray, cloudwatch
Extension- enhance capability for a platform/environments
- Example : healthcheck and sigV4
How otel works
OpenTelemetry APIs and SDK- Instrumentation: OpenTelemetry allows you to add special components (instrumentation) to your software applications. These components act like sensors, capturing important data about how your application behaves. There are different ways to add this instrumentation. You can either do it manually by adding specific code or use tools that can automatically instrument your application.Data Processing:- OpenTelemetry extension or processing layer Once the instrumentation is in place, it collects data as your application runs. This data may include information about response times, errors, resource usage, and more. This collected data is then processed, which means organizing and preparing it for analysis.Data Export:- OpenTelemetry In process Exporter : After processing, the telemetry data can be exported. OpenTelemetry provides flexibility in how you do this. You can send the data directly to monitoring and analysis services, like cloud-based tools or custom systems designed to handle telemetry data. Alternatively, you can choose to send the data to the OpenTelemetry Collector.Analysis and Monitoring:The telemetry data is now available for analysis. Monitoring and observability tools can use this data to provide insights into how your application is performing. This includes understanding performance bottlenecks, identifying and troubleshooting issues, and optimizing your application for better efficiency and reliability.
What is AWS Distro for Opentelemetry?
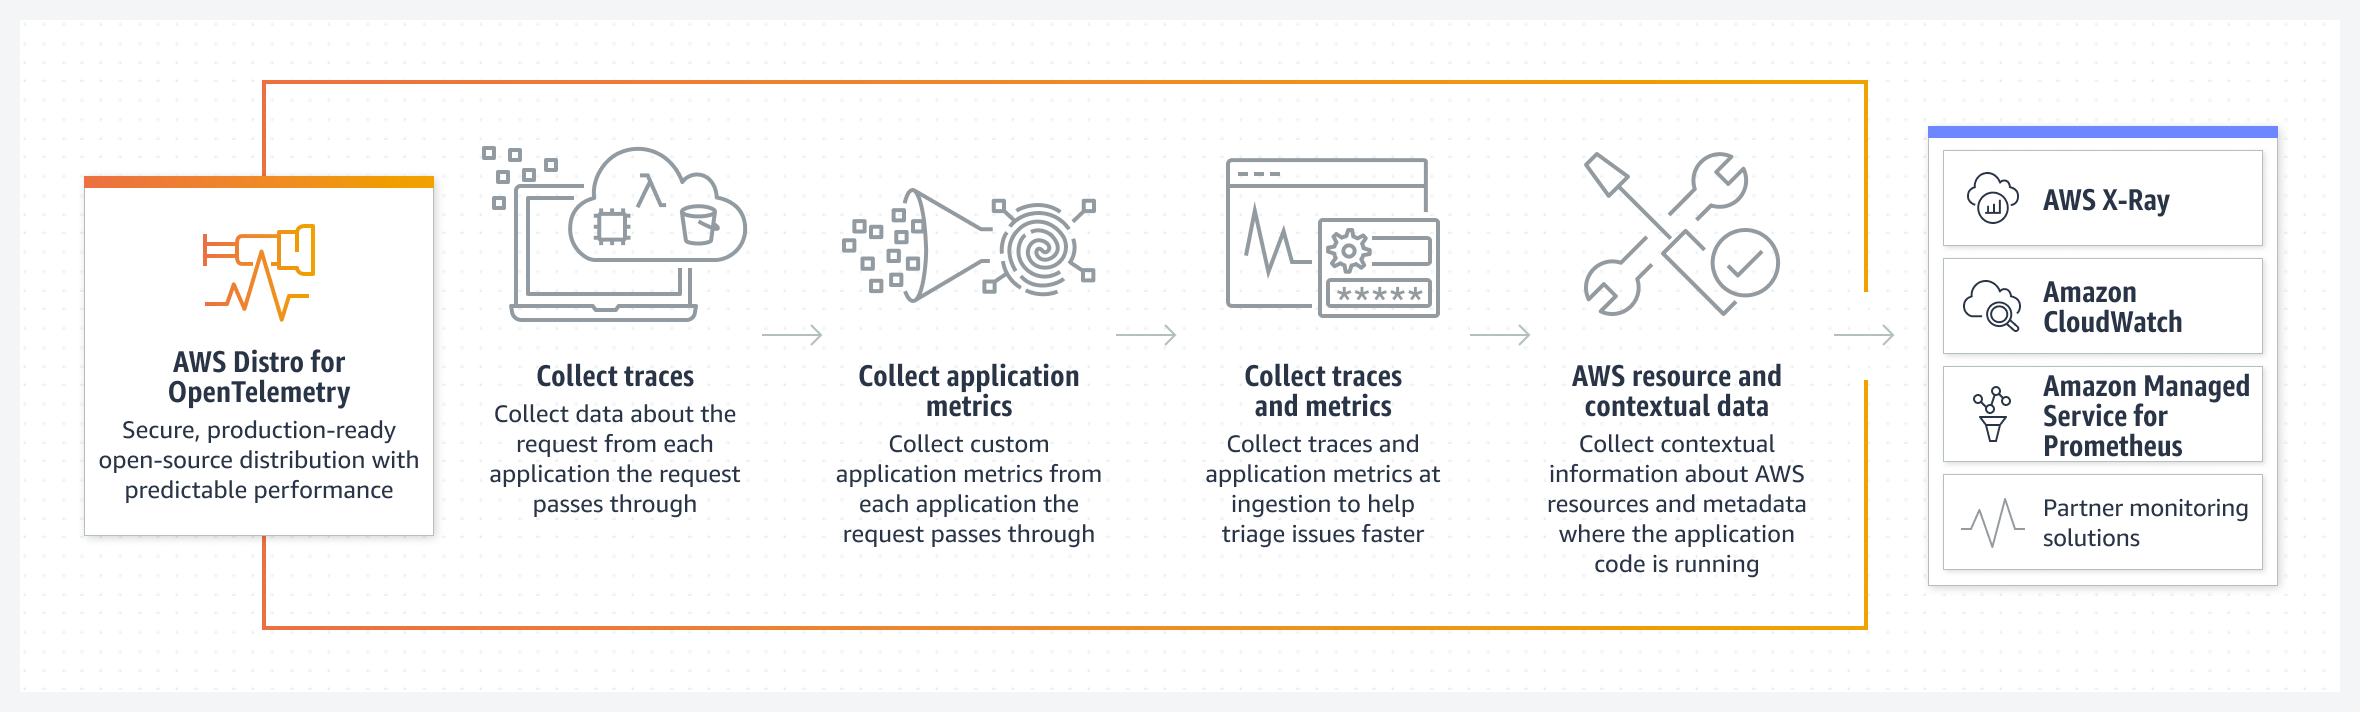 AWS Distro for opentelemetry(ADOT) is a secure, production ready, AWS Supported distribution of the opentelemetry project.
Here are some key points about AWS Distro for OpenTelemetry:
Compatibility with AWS Services:ADOT is designed to seamlessly integrate with AWS’s suite of cloud services, making it easier for users of AWS to gather and analyze telemetry data.Support for OpenTelemetry Standards:ADOT adheres to the standards and APIs established by the OpenTelemetry project. This means that it can work with other OpenTelemetry components and libraries.Ease of Use:AWS Distro for OpenTelemetry simplifies the process of instrumenting applications running in AWS environments to collect telemetry data, which is essential for monitoring and improving application performance.Integration with AWS Observability Services:ADOT can easily connect to AWS observability and monitoring services such as Amazon CloudWatch, AWS X-Ray, and AWS Elasticsearch, enhancing the capabilities of these services by providing more detailed insights into application behavior.Consistency:ADOT ensures a consistent and reliable way to collect telemetry data in AWS environments, making it easier for users to manage and analyze this data, especially at scale.
Use Cases of ADOT
- Customer who want to use standardized production ready open source opentelemetry api to collect correlated metrics and traces.
- customer who want to instrument their code once to send metrics and traces to one or more aws and third part monitoring services.
- Customer who wants to take advantage of wide set of languages and auto instrumentation agents supported by opentelemetry.
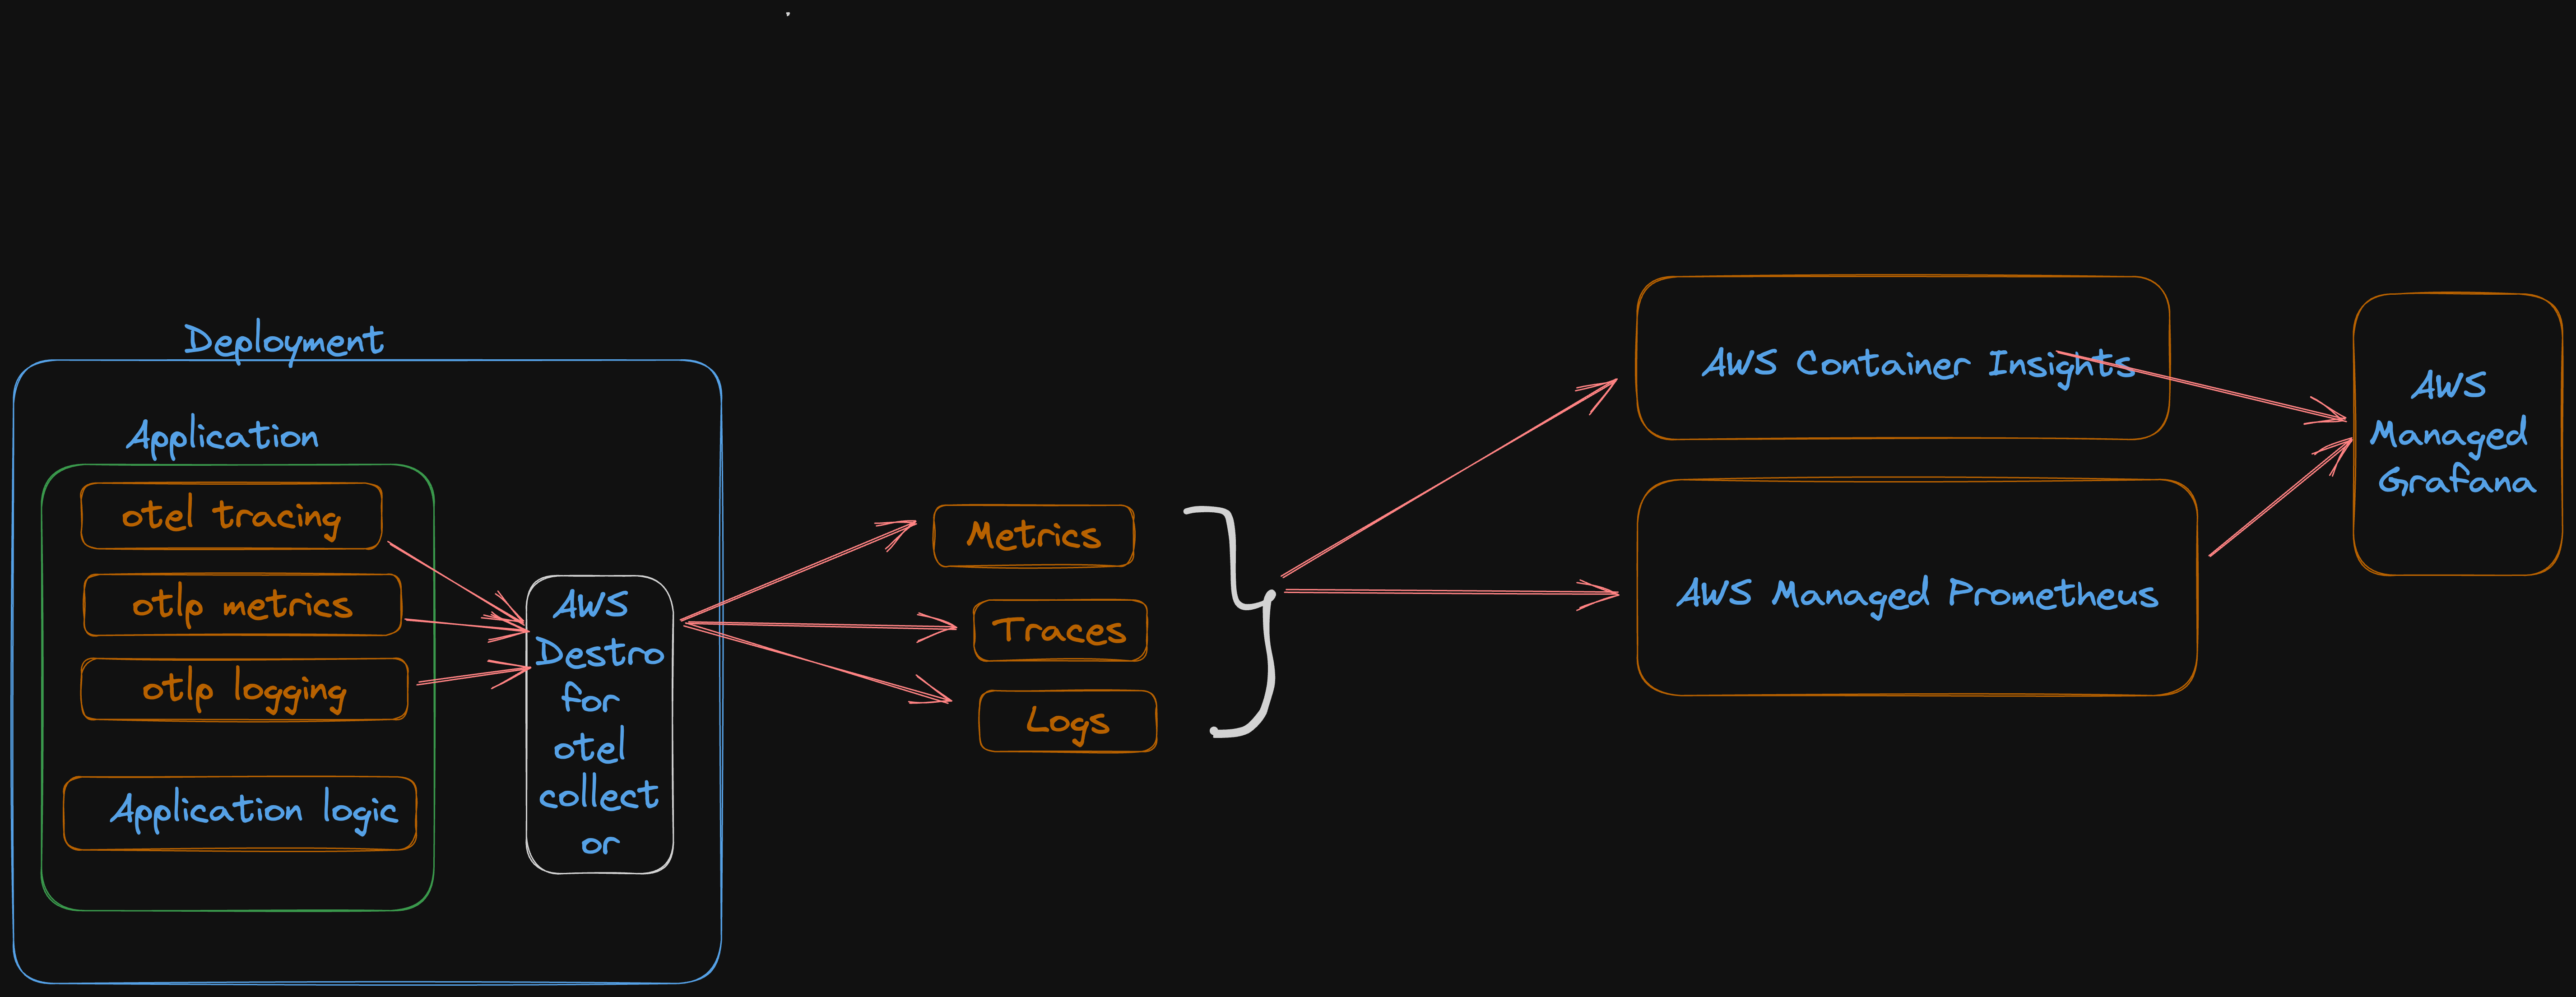
ADOT deployment Model in EKS
Deployment:Use this mode of you want to get more control of the collector and create a standalone application.Daemonset:Use this mode if you want the collector to run an agent in your worker nodes. Each node will have its own collector copy which would monitor the pods in it.Statefulset:use this mode to guarantee predictable naming,rescheduling and target allocation of scrape targets.- Sidecar: Use this mode on the container level when no new pods need to be created.
Conclusion
OpenTelemetry and AWS Distro for OpenTelemetry (ADOT) are your dynamic duo for achieving observability in your cloud-native applications. They grant you the power to see the inner workings of your applications, identify issues, and optimize performance. By following these steps, you’ll be well on your way to gaining valuable insights and harnessing the full potential of your applications in the AWS environment. Happy observing!🚀🔍😊